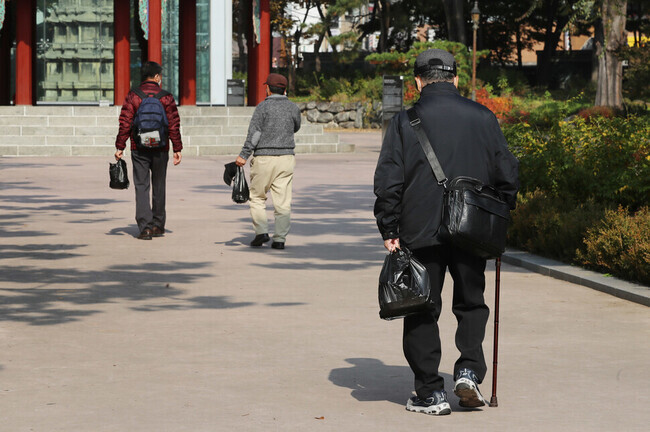
People walk through Seoul’s Pagoda Park in this undated file photo. (Shin So-young/The Hankyoreh)
How much money does a household ranked in the top 10% for income in South Korea make in a year?
The answer last year was an average of 190,420,000 won (US$146,000). Members of this bracket had average assets of 1,554,750,000 won, including real estate.
In contrast, the average annual income for a household in the bottom 10% was 8,970,000 won (US$6,900) last year, while total assets averaged 124,070,000 won.
The income gap between the top and bottom 10% was a difference of 21 times, with a 13-fold difference in assets. The income gap, in particular, began expanding last year as the government cut back its support to lower income brackets.
On Tuesday, the Hankyoreh analyzed the situations different South Korean income deciles face as shown in data from Statistics Korea’s Survey of Household Finances and Living Conditions for 2022.
The decile ratio for income, representing the average annual income of the richest 10% of households divided by the income of the poorest 10%, came out to 21.2 last year. This means that the top-earning 10% earned 21 times as much income as the bottom-earning 10%.
This marked the first time Statistics Korea shared figures for income deciles, where all South Korean households are separated into 10 segments of 10% each according to income level.
The decile ratio for income had previously been declining steadily. When National Tax Service figures were first reflected in the statistics in 2016, the ratio stood at 25.4; by 2020, it was down to 20.2. The shift reflected growing support for low-income aging Koreans, including increased pension benefits and jobs.
The indicator’s change for the worse last year can be attributed to a combination of declining government support for low-income brackets and the fact that the rise in earned income for the top 10% of households was much bigger than the rise for the bottom 10%.
While the government’s COVID-19 support was expanded last year to include self-employed business operators ranked as middle class or higher, public transfer payments — which represents over half of earnings for the bottom-ranked 10% of households — decreased from 5,290,000 won to 5,230,000 won annually per household.
One noteworthy development has been the fast increase in government transfer payments to households, which has risen by an average of around 12% annually in the past five years. This reflects a large increase in the recipients of national pension and other public pension benefits as members of the baby-boom generation have begun retiring in earnest.
Indeed, during the pre-pandemic period from 2017 to 2019, the average annual rate of increase in public transfer income exceeded 10% for households in the top 20%–50% range by income. This was higher than the 9.5% rate of increase in transfer income for households in the bottom 10% over the same period.
The problem is that the income gap between low-income households and middle- to high-income households is very likely to grow going forward.
Many of the low-income older Koreans who make up a large part of the bottom 10% of households are not enrolled in the national pension or other public pensions. This could end up translating into an even bigger divide between middle-class households that receive public pension benefits and impoverished aging households that do not.
The ratio of total asset value for the top 10% of South Koreans by income to the asset value for the bottom 10% also rose from 11.8 in late March 2017 to 12.5 as of late March 2022.
While the highest-earning 10% of households saw their average assets increase by 44% (477,300,000 won) from 1,077,450,000 won to 1,554,750,000 won over this period, assets for the lowest-earning 10% rose by 35% (32,480,000 won) from 91,590,000 won to 124,070,000 won.
By Park Jong-o, staff reporter
Please direct questions or comments to [
english@hani.co.kr]


